March 4, 2019
Founders’ Story
Data Lake Intelligence with AtScale
In my recent Data Lake 2.0 article, I described how the worlds of big data and cloud are coming together to reshape the concept of the data lake. The data lake is an important element of any modern data architecture, and the data lake footprint will continue to expand. However, the data lake investment is only one part of delivering a modern data architecture. At Yahoo!, in addition to building a Hadoop-based data lake, we also needed to solve the problem of connecting traditional business intelligence workloads to this Hadoop data. Although the term “Data Lake” didn’t exist back then, we were solving the problem of: “How can you deliver an interactive BI experience on top of a scale-out Data Lake” – it turns out we were pioneers in delivering Data Lake Intelligence.
See AtScale in action
Our experiences and learnings from those initial efforts led to the architecture that sits at the core of the AtScale Intelligence Platform. Because AtScale has been built from the ground up to deliver business-friendly insights from the vast amounts of information in data lakes, AtScale has experienced tremendous success and adoption in enterprises ranging from financial services, to retail to digital media. With the release of AtScale 6.5, we’ve continued to build on and expand AtScale’s ability to uniquely deliver on the promise of Data Lake Intelligence. If this sounds like something you might be interested in knowing more about… keep reading!
Enabling Governed Self-Service with Perspectives
IT organizations tasked with delivering insights on enterprise data lakes face several challenges. The first is how to enable self-serve data access to the data lake in a form factor that is consumable by business users using the tools and languages they are most comfortable with. Ultimately, a common vocabulary for measures and dimensions and the right consumption interfaces are critical for BI success. From the beginning, AtScale has been designed to bridge the gap between raw data lake tables and files and the BI tools that need to consume them. Our Virtual Cube concept projects a multi-dimensional interface that can be queried by the top self-service BI tools – like Tableau, PowerBI, and Excel – using either SQL or MDX.
One common request we’ve heard from customers is to help them derive even more value from the virtual cube concept, with a focus on two things: scaling their data curation efforts by enabling a broader set of users to benefit from a shared set of concepts, while at the same time ensuring that access to certain “protected” data elements (for example financial metrics) is restricted to only authorized users. With the release of Perspectives in AtScale 6.5, we are now able to address both of these requirements.
Perspectives are publishable subsets of the data model of an underlying AtScale cube. They are meant to make it easier for analysts to query only the subset of data in a virtual cube that is relevant to their purposes or responsibilities. Rather than provide analysts with the entire data model for a cube, you can make dimensions, hierarchies, levels, secondary attributes, measures, and calculated measures in that cube invisible to them.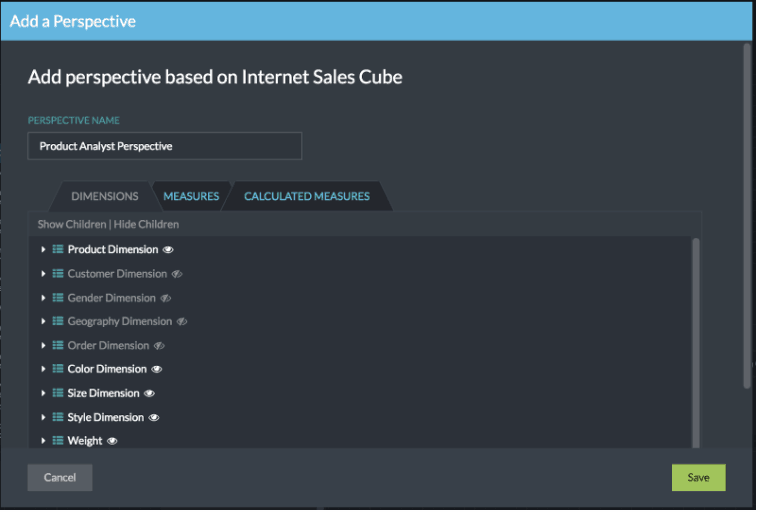
Once created, AtScale’s robust user and group management capabilities allow data modelers to appropriately grant access to specific Perspectives, as shown here. This capability provides an extra level of security and control on top of AtScale’s already robust security capabilities.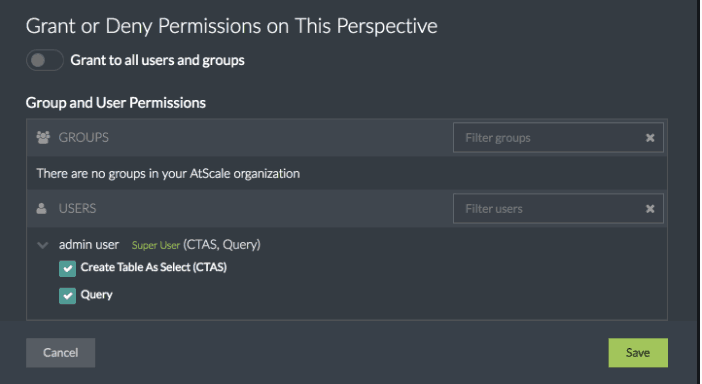
With Perspectives, customers can now publish a Universal Semantic Layer once and access it using any BI tool. Combined with AtScale’s sophisticated data access and data governance capabilities, IT organizations can now enable business users to get the data they are entitled to, across multiple AtScale models, multiple user types, and with any tool.
Unprecedented Analytics At Scale
Delivering analytic insights on top of big data requires more than just a visualization UI and a SQL interface. The core concepts of OLAP that have evolved over decades – hierarchies, semi-additive metrics, time relative queries, and analytic functions – are critical to enabling the successful realization of scale-out business insights.
With AtScale 6.5, we are now delivering robust support for percentile-based analytic functions that work on the largest of data sets and are amenable to the hierarchical analysis that is common in typical business analysis. Percentile-based analytics can help you understand important aspects of your dataset, ranging from the data’s overall shape to single record ranking. Percentiles can help with the following analytical scenarios:
- Helping to reduce the sensitivity of averages to outliers, by supporting median calculations instead. For example, a small number of very expensive homes may make the average selling price much larger than the median selling price.
- Visibility into data skew, which can pre present in cases where there is a non-normal distribution of values.
- Identifying tiers in your data, for example you may want to rank your customers by average sales amount and select the subset that rank above the 75th percentile of sales.
- Understanding how one record compare to the rest – for example, how does a particular supplier’s delivery performance compare with all suppliers of the same part?
For AtScale Virtual Cube designers, the process of creating percentile metrics is extremely simple and intuitive. In AtScale’s Design Center, create a percentile measure by dragging the appropriate column to the measure panel to pop up the measure creation dialog.
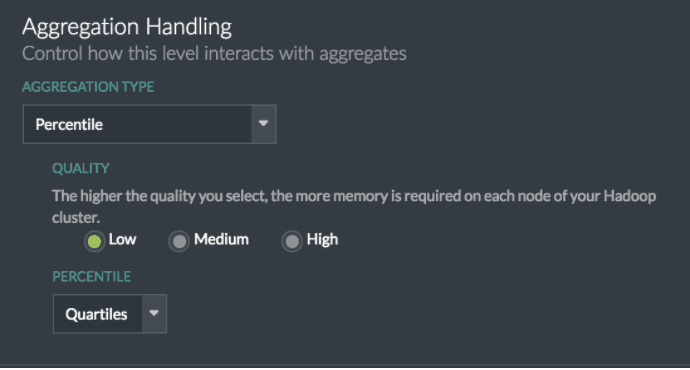
Simply choose the “Percentile” aggregation type, then specify an accuracy level (higher accuracy requires more computational resources), and choose the desired percentile configuration. AtScale ships with the following predefined Percentile configurations: Median, Quartiles, Deciles, and Custom.
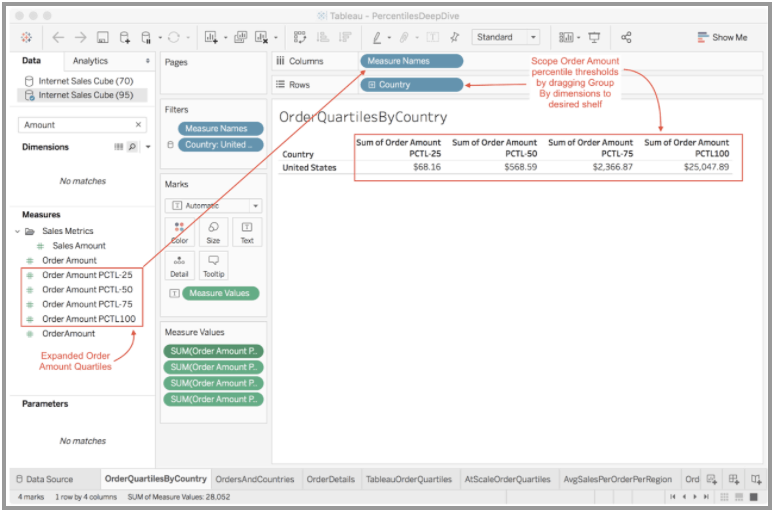
Once created, percentile metrics are automatically available to any analysis client that connects to the AtScale Virtual Cube. In the example shown here you can see how the four quartile metrics defined within AtScale (on a single fact column) are now available for analysis with the Tableau user interface.
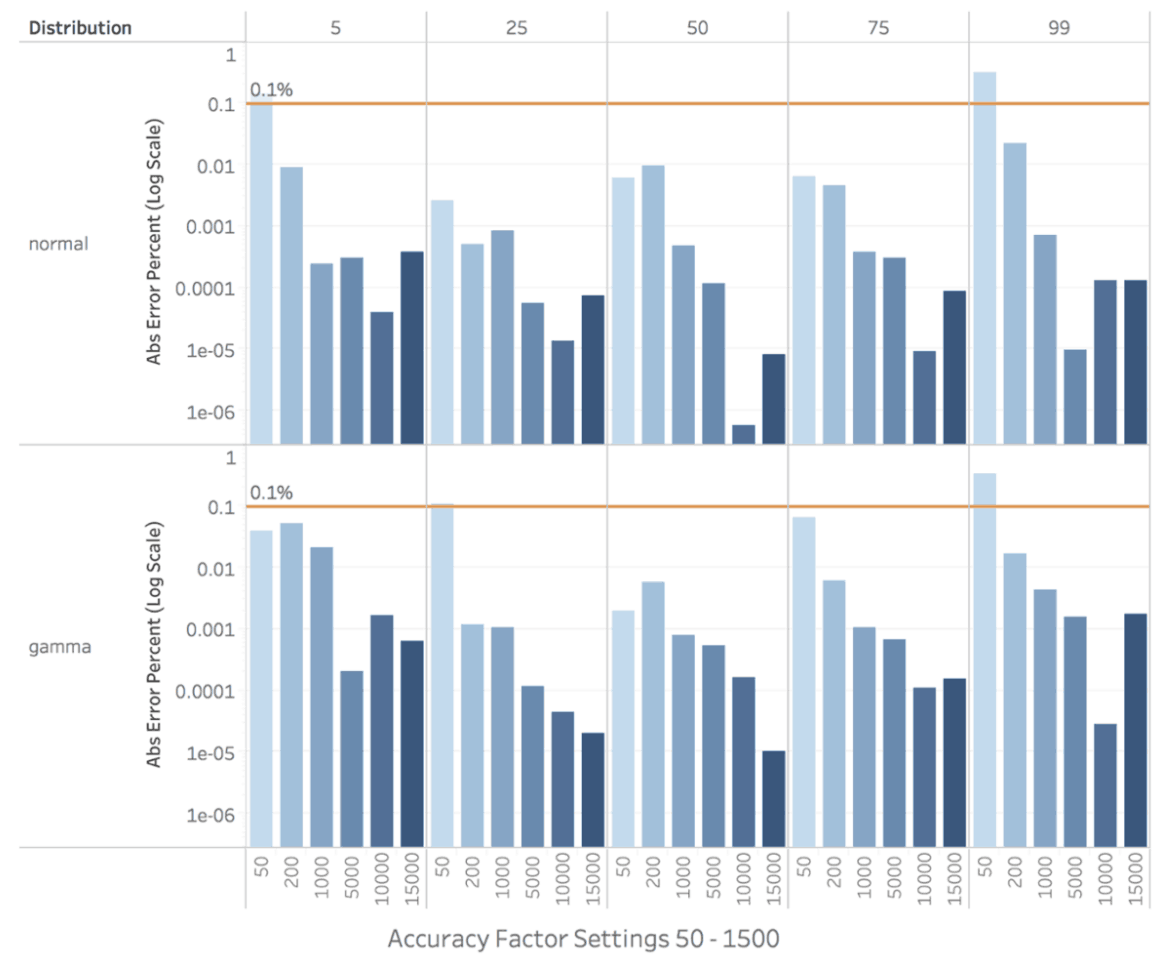
We are thrilled with the results of our approach to delivering this valuable analytical capability. Although AtScale’s percentile metrics are sample based, the error rate of these metrics are consistently under 0.1%.
 The net result for AtScale users is the ability to perform even more complex and business-relevant analytics with interactive performance, on even the largest data sets.
Data Lake Migration – Faster, Easier, Optimal
One of the core themes that remains central to the AtScale vision and roadmap is to make the process of creating virtual cubes as fast and as easy as possible. With the release of AtScale 6.5 we are excited to share a number of new capabilities to help deliver on this promise:
- For customers who are migrating existing Tableau workbooks to run on their enterprise data lake, AtScale now offers a Tableau Workbook Optimization utility. This utility can ingest any number of Tableau workbooks, identify common business logic contained in each workbook, and automatically create an AtScale model that can act as a shared semantic layer that enables these workbooks to perform at scale and with consistency once migrated to the data lake.
- We’ve continued to expand our MDX support, meaning that customers who are looking to move traditional BI platform workloads – from tools like Microstrategy, Business Objects, or Cognos – to a data lake can benefit from the performance and consistency enabled by AtScale’s virtual cubes.
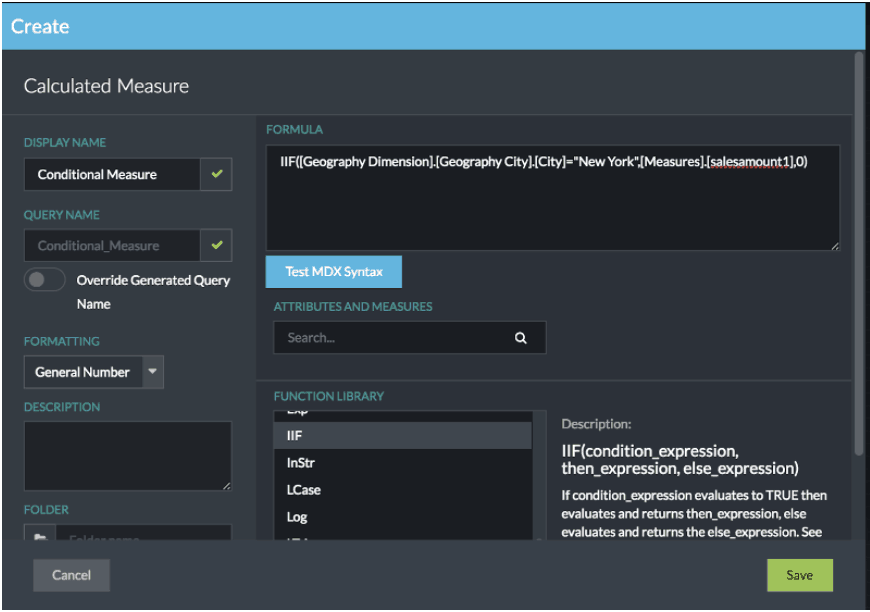
- We’ve enhanced our calculated column and customer metrics dialogs to include a rich set of helpers to assist in the creation of valid and accurate SQL and MDX calculations, vastly reducing the amount of time required to build and deploy new metrics.
Time to Get Started!
As you can tell – I am very excited about this release. It is a major step to realizing our company’s vision. With AtScale 6.5 our customers will immediately derive value from the capabilities above and will continue to benefit from the industry’s most robust and scalable business interface for big data.
I invite you to learn more about AtScale today!
Power BI/Fabric Benchmarks